
Summary

- Plugin name : Continuous Bitmap
- Version : 1.0
- Author : Yann Renard
- Company : Mensia Technologies SA
- Short description : Displays the input matrices as a map of colored tiles, or bitmap, continuously.
- Documentation template generation date : Dec 3 2018
Description
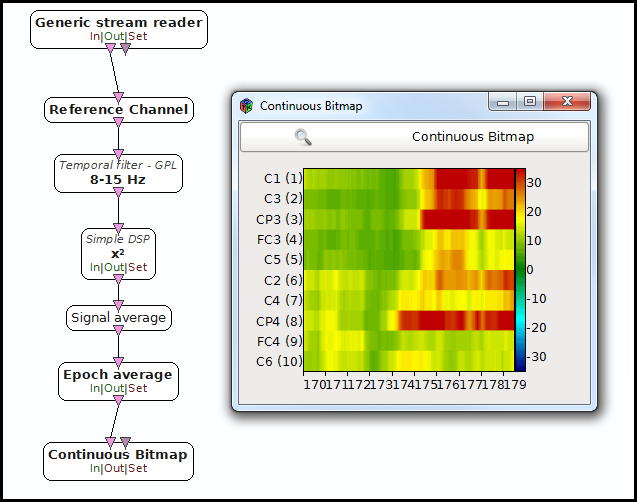
The Continuous Bitmap displays input data in form of a 2D map of colored blocks (or bitmap). The display is done continuously , meaning that once the end of the horizontal scale is reached, it goes back to the origin.
The Continuous Bitmap box shares common concepts and settings with the other boxes in the Mensia Advanced Visualization Toolset . Additional information are available in the dedicated documentation pages:
Inputs
1. Matrix
The first input can be a streamed matrix or any derived stream (Signal, Spectrum, Feature Vector). Please set the input type according to the actual stream type connected.
- Type identifier : Streamed matrix (0x544a003e, 0x6dcba5f6)
2. Markers
The second input expect stimulations. They will be displayed as red vertical lines .
- Type identifier : Stimulations (0x6f752dd0, 0x082a321e)
Settings
1. Channel Localisation
The channel localisation file containing the cartesian coordinates of the electrodes to be displayed. A default configuration file is provided, and its path stored in the configuration token ${AdvancedViz_ChannelLocalisation}.
- Type identifier : Filename (0x330306dd, 0x74a95f98)
- Default value : [ ${AdvancedViz_ChannelLocalisation} ]
2. Temporal Coherence
Select Time Locked for a continuous data stream, and specify the time scale below. Select Independent for a discontinuous data stream, and specify the matrix count below.
- Type identifier : Temporal Coherence (0x8f02e3f6, 0xffb00f4b)
- Default value : [ Time Locked ]
3. Time Scale
The time scale in seconds, before the displays goes back to the origin.
- Type identifier : Float (0x512a166f, 0x5c3ef83f)
- Default value : [ 20 ]
4. Matrix Count
The number of input matrices to receive before the displays goes back to the origin.
- Type identifier : Integer (0x007deef9, 0x2f3e95c6)
- Default value : [ 50 ]
5. Gain
If this checkbox is ticked, the vertical scale is shifted so that 0 is at the bottom. Only positive values will be displayed.
- Type identifier : Float (0x512a166f, 0x5c3ef83f)
- Default value : [ 1 ]
6. Caption
Gain (floating-point scalar factor) to apply to the input values before display.
- Type identifier : String (0x79a9edeb, 0x245d83fc)
- Default value : [ ]
7. Color
Label to be displayed on top of the visualization window.
- Type identifier : (0x3d3c7c7f, 0xef0e7129)
- Default value : [ ${AdvancedViz_DefaultColorGradient} ]
Examples
In the following example, we compute the band power of the input signal in the 8-15 Hz frequency range, and average it over the last 32 epochs received.
You can find a commented scenario in the provided sample set, the scenario file name is {ContinuousBitmap.mxs}.
Miscellaneous
Generated on Tue Jun 26 2012 15:25:54 for Documentation by
 1.7.4
1.7.4