
Summary

- Plugin name : Power spectrum display
- Version : 1.0
- Author : Vincent Delannoy
- Company : INRIA/IRISA
- Short description : Power spectrum in frequency bands
- Documentation template generation date : May 20 2016
Description
TODO
The power spectrum displays the amplitude of a signal in a set of frequency bands. One 2D graph is plotted per channel, where amplitudes are distributed on the vertical axis and frequency bands on the horizontal axis. There is one spectrum per channel.
Inputs
1. Spectrum
Power spectrum of each channel to display.
- Type identifier : Spectrum (0x1f261c0a, 0x593bf6bd)
Settings
Offline settings include the minimum and maximum frequencies to display. If these frequencies lie outside the effective incoming frequency range, they will be clamped to it at Player start time.
1. Minimum frequency to display
Minimum frequency to display in power spectra
- Type identifier : Float (0x512a166f, 0x5c3ef83f)
- Default value : [ 0 ]
2. Maximum frequency to display
Maximum frequency to display in power spectra
- Type identifier : Float (0x512a166f, 0x5c3ef83f)
- Default value : [ 40 ]
Online visualisation settings
Online settings :
- Best Fit : clicking this button ensures the vertical scale is adapted to the sample values plotted on all channels.
- Best Fit per Channel : similar to the previous button, only this time the vertical scale is adapted on a per-channel basis.
- Left/Bottom Ruler : these buttons toggle amplitude values and frequency values on/off.
- Min/Max Frequency : the range of frequency bands that are drawn may be adjusted with these buttons.
- Select Channels : clicking this button pops up a dialog that allows to show/hide some of the channels.

Examples
Miscellaneous
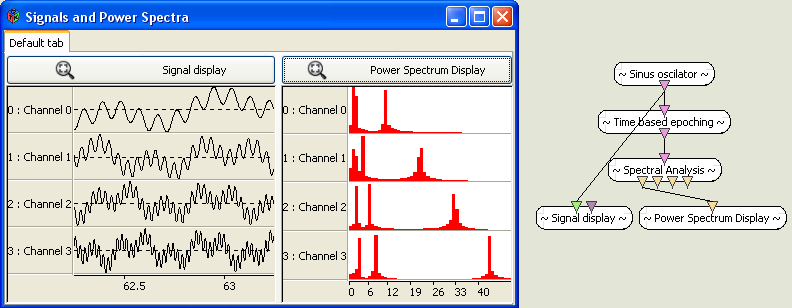
This example is based on the following scenario file : tutorials/visualisation/sample_power_spectrum
Let's use a Sinus Oscillator to generate sinusoidal signals. A Signal Display box will be used in addition to a Power Spectrum box (both are found under '2D Visualisation) to visualise signals and their spectra at the same time.
The power spectrum plugin has one input connector of 'Spectrum' type. Indeed, signal information must be processed before being sent to this plugin, so that amplitude values are computed for a set of frequency bands. These computations can be done using a Spectral Analysis filter (found under 'Signal Processing > Spectral Analysis'), making sure 'Amplitude' computation is enable in its settings (see Doc_SignalProcessing_SpectralAnalysis for more on this). However, results might not be satisfactory due to the small size of data chunks being processed by the Spectral Analysis plugin.
To feed the plugin more significant data, one can use the Time-Based Epoching plugin to store data and send it only when it amounts to a given duration (see Doc_SignalProcessing_Epoching to learn more about this box). One can insert an epoching box right after a Sinus Oscillator, setting its epoch duration to e.g. 1s and epoch intervals to 0.0625s (1/16th of a second). This will ensure 1s-long chunks are sent 16 times a second to the Spectral Analysis box.
Typical spectra of combinations of sinusoidal signals, as generated by a Sinus Oscillator box, should look like the following :
Generated on Tue Jun 26 2012 15:25:54 for Documentation by
 1.7.4
1.7.4