
Summary

- Plugin name : 2D Topography
- Version : 1.0
- Author : Yann Renard
- Company : Mensia Technologies SA
- Short description : The input is mapped to a 2 dimensional plane model of the scalp surface, using a color gradient and interpolation.
- Documentation template generation date : Dec 3 2018
Description
The 2D Topography box combines EEG measures with topological information. The input, being signal, spectrum, or any other metric, is mapped to a 2 dimensional plane model of the scalp surface, rendered in a 3D context. This box is provided with a preconfigured channel localisation file that contains the cartesian coordinates of every electrode positions of the extended 10-20 system. The mapping is done according to these coordinates using spherical spline interpolation. A color gradient is used to display the information, and can be customized at will to easily enhance or smooth the contrasts. Several presets are available, to match the gradients you may be already familiar with when using existing softwares such as Matlab or Elan. The color gradient is mapped to the current data scale, centered around 0.
The 2D Topography box shares common concepts and settings with the other boxes in the Mensia Advanced Visualization Toolset. Additional information are available in the dedicated documentation pages:
Inputs
1. Matrix
The box input can be a streamed matrix or any derived stream (Signal, Spectrum, Feature Vector). Please set the input type according to the actual stream type connected.
- Type identifier : Signal (0x5ba36127, 0x195feae1)
Settings
1. Channel Localisation
The channel localisation file containing the cartesian coordinates of the electrodes to be displayed. A default configuration file is provided, and its path stored in the configuration token ${AdvancedViz_ChannelLocalisation}.
- Type identifier : Filename (0x330306dd, 0x74a95f98)
- Default value : [ ${AdvancedViz_ChannelLocalisation} ]
2. Gain
Gain (floating-point scalar factor) to apply to the input signal before display.
- Type identifier : Float (0x512a166f, 0x5c3ef83f)
- Default value : [ 1 ]
3. Caption
Label to be displayed on top of the visualization window.
- Type identifier : String (0x79a9edeb, 0x245d83fc)
- Default value : [ ]
4. Color
Color gradient to use. This setting can be set manually using the color gradient editor. Several presets exist in form of configuration tokens ${AdvancedViz_ColorGradient_X}, where X can be:
MatlaborMatlab_DiscreteIconorIcon_DiscreteElanorElan_DiscreteFireorFire_DiscreteIceAndFireorIceAndFire_Discrete
The default values AdvancedViz_DefaultColorGradient or AdvancedViz_DefaultColorGradient_Discrete are equal to </t>Matlab and Matlab_Discrete.
An example of topography rendering using these color gradients can be found here.
- Type identifier : (0x3d3c7c7f, 0xef0e7129)
- Default value : [ ${AdvancedViz_DefaultColorGradient} ]
Examples
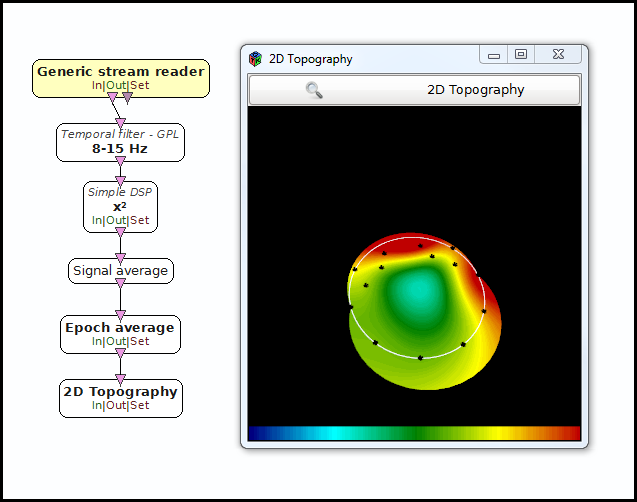
In the following example, we compute the band power of the signal in the 8-15 Hz frequency range, and average it over the last 32 epochs received.
You can find a commented scenario in the provided sample set, the scenario file name is {2DTopography.mxs}.
Miscellaneous
Generated on Tue Jun 26 2012 15:25:54 for Documentation by
 1.7.4
1.7.4