
Summary

- Plugin name : Instant Oscilloscope
- Version : 1.0
- Author : Yann Renard
- Company : Mensia Technologies SA
- Short description : Displays each and every input matrix as a series of curves, instantly. Channels are vertically distributed.
- Documentation template generation date : Apr 11 2018
Description
The Instant Oscilloscope displays temporal numerical data in the form of curves. The display is done instantly , meaning that whenever a new data block arrives, it is displayed in the visualization windows, filling all the horizontal space.
The Instant Oscilloscope box shares common concepts and settings with the other boxes in the Mensia Advanced Visualization Toolset . Additional information are available in the dedicated documentation pages:
Inputs
This box supports input modification: you can add or remove inputs at will.
1. Matrix
The input can be a streamed matrix or any derived stream (Signal, Spectrum, Feature Vector). Please set the input type according to the actual stream type connected.
- Type identifier : Signal (0x5ba36127, 0x195feae1)
Settings
1. Channel Localisation
The channel localisation file containing the cartesian coordinates of the electrodes to be displayed. A default configuration file is provided, and its path stored in the configuration token ${AdvancedViz_ChannelLocalisation}.
- Type identifier : Filename (0x330306dd, 0x74a95f98)
- Default value : [ ${AdvancedViz_ChannelLocalisation} ]
2. Positive Data Only ?
If this checkbox is ticked, the vertical scale is shifted so that 0 is at the bottom. Only positive values will be displayed.
- Type identifier : Boolean (0x2cdb2f0b, 0x12f231ea)
- Default value : [ false ]
3. Gain
Gain (floating-point scalar factor) to apply to the input values before display.
- Type identifier : Float (0x512a166f, 0x5c3ef83f)
- Default value : [ 1 ]
4. Caption
Label to be displayed on top of the visualization window.
- Type identifier : String (0x79a9edeb, 0x245d83fc)
- Default value : [ ]
5. Translucency
This setting expect a value between 0 and 1, from transparent to opaque color rendering (nb: this value is the alpha component of the color).
- Type identifier : Float (0x512a166f, 0x5c3ef83f)
- Default value : [ 1 ]
6. Color
Color gradient to use. This setting can be set manually using the color gradient editor. Several presets exist in form of configuration tokens ${AdvancedViz_ColorGradient_X}, where X can be:
MatlaborMatlab_DiscreteIconorIcon_DiscreteElanorElan_DiscreteFireorFire_DiscreteIceAndFireorIceAndFire_Discrete
The default values AdvancedViz_DefaultColorGradient or AdvancedViz_DefaultColorGradient_Discrete are equal to </t>Matlab and Matlab_Discrete.
An example of topography rendering using these color gradients can be found here.
- Type identifier : (0x7f45a2a9, 0x7db12219)
- Default value : [ ${AdvancedViz_DefaultColor} ]
Examples
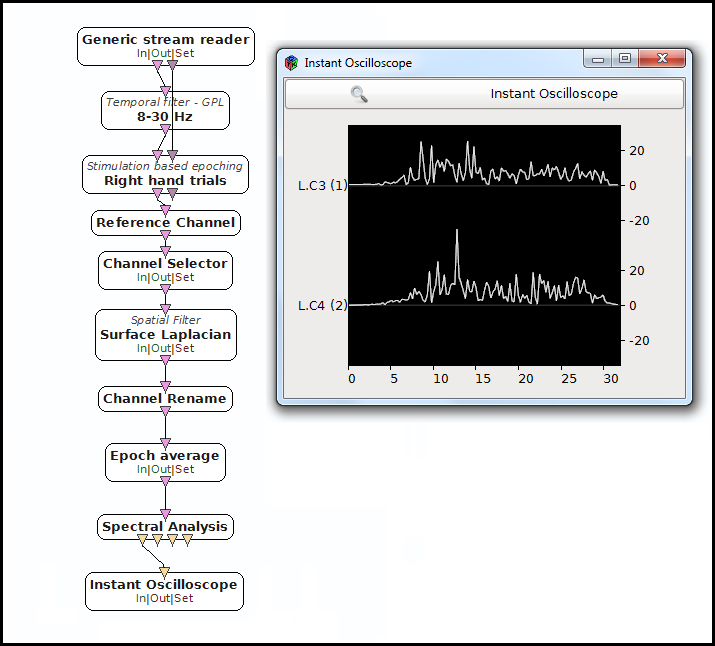
In the following example, we compute the FFT of the average right hand trial in a Motor Imagery session, and visualize the spectrum around left and right motor cortices through 2 Laplacian filters around C3 and C4.
You can find a commented scenario in the provided sample set, the scenario file name is {InstantOscilloscope.mxs}.
Miscellaneous
Generated on Tue Jun 26 2012 15:25:54 for Documentation by
 1.7.4
1.7.4