
Summary

- Plugin name : Spectral analysis
- Version : 0.1
- Author : Guillaume Gibert
- Company : INSERM
- Short description : Compute spectral analysis using Fast Fourier Transform
- Documentation template generation date : Jul 24 2014
Description
The Spectral Analysis box performs spectrum computations on incoming signals and possible outputs include the spectrum amplitude (the power of the signal in a number of frequency bands), as well as its phase, real part and imaginary part. Output computations may be enabled/disabled from the settings dialog box. The analysis is performed using a Fast Fourier Transform .
Inputs
1. Input signal
The input signal.
- Type identifier : Signal (0x5ba36127, 0x195feae1)
Outputs
1. Amplitude
Amplitude of input signal in frequency bands.
- Type identifier : Spectrum (0x1f261c0a, 0x593bf6bd)
2. Phase
Phase of input signal
- Type identifier : Spectrum (0x1f261c0a, 0x593bf6bd)
3. Real Part
Real part of input signal
- Type identifier : Spectrum (0x1f261c0a, 0x593bf6bd)
4. Imag Part
Imaginary part of input signal
- Type identifier : Spectrum (0x1f261c0a, 0x593bf6bd)
Settings
1. Spectral components
- Type identifier : Spectral component (0x764e148a, 0xc704d4f5)
- Default value : [ Amplitude ]
Examples
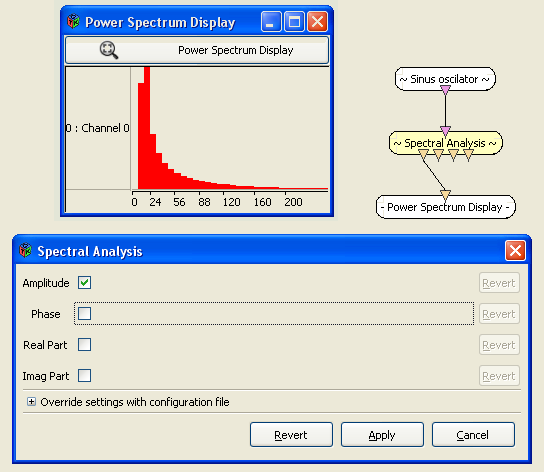
Practical example : visualising the power spectrum of a signal.
Let's use a Signal Oscillator box to generator sinusoidal signals on one channel. Next we add a Spectral Analysis box and connect boxes together. We make sure the 'Amplitude' of the signal is computed by checking the appropriate setting in the settings dialog box (see image below). Finally, we connect the 'Amplitude' output connector of the Spectral Analysis box to the input connector of a Power Spectrum Display box. The player may now be launched to visualize the power spectrum of the signal.
Miscellaneous
Generated on Tue Jun 26 2012 15:25:54 for Documentation by
 1.7.4
1.7.4